
The Distribution Manifesto
Chapter 9 of 11 · 17 min read
The Economics of Distribution
What to Count, What to Compare, and What Not to Claim
The argument
The economics of Creator-Powered Distribution are not the economics of cheap views.
Cheap views can be useful. Cheap views can also be worthless. A system can produce low-cost impressions from the wrong audience, on the wrong surface, through the wrong creator, with no reusable asset value, no learning value, no trust value, and no downstream business effect. That system may look efficient in a spreadsheet while being strategically weak.
Creator-Powered Distribution needs a stronger economic model.
The correct unit is not simply the view, the clip, the post, or the creator. The correct economic object is the qualified distribution event: a measurable interaction between source content, creator context, platform surface, audience fit, incentive design, governance, and downstream objective.
This chapter defines the economics of that event.
The core argument is:
Creator-Powered Distribution should be measured as a portfolio of attention output, asset output, learning output, business output, and compounding infrastructure value.
That does not mean CPM is irrelevant. CPM is still useful. But CPM alone is insufficient. Creator-powered campaigns can create several forms of value paid media does not automatically create:
- Reusable short-form assets.
- Creator relationships.
- Format intelligence.
- Hook intelligence.
- Audience-pocket mapping.
- Platform-native proof.
- Sales-assist content.
- Organic search and social residue.
- Creator Capital that improves future campaigns.
A serious economic model must count those outputs separately instead of collapsing everything into one vanity ratio.
The practical result is a different budgeting conversation.
The weak question is:
How low can we get the CPM?
The stronger question is:
What is the fully loaded cost to generate qualified attention, reusable assets, validated learnings, creator-network improvement, and qualified outcomes?
That is the question this chapter answers.
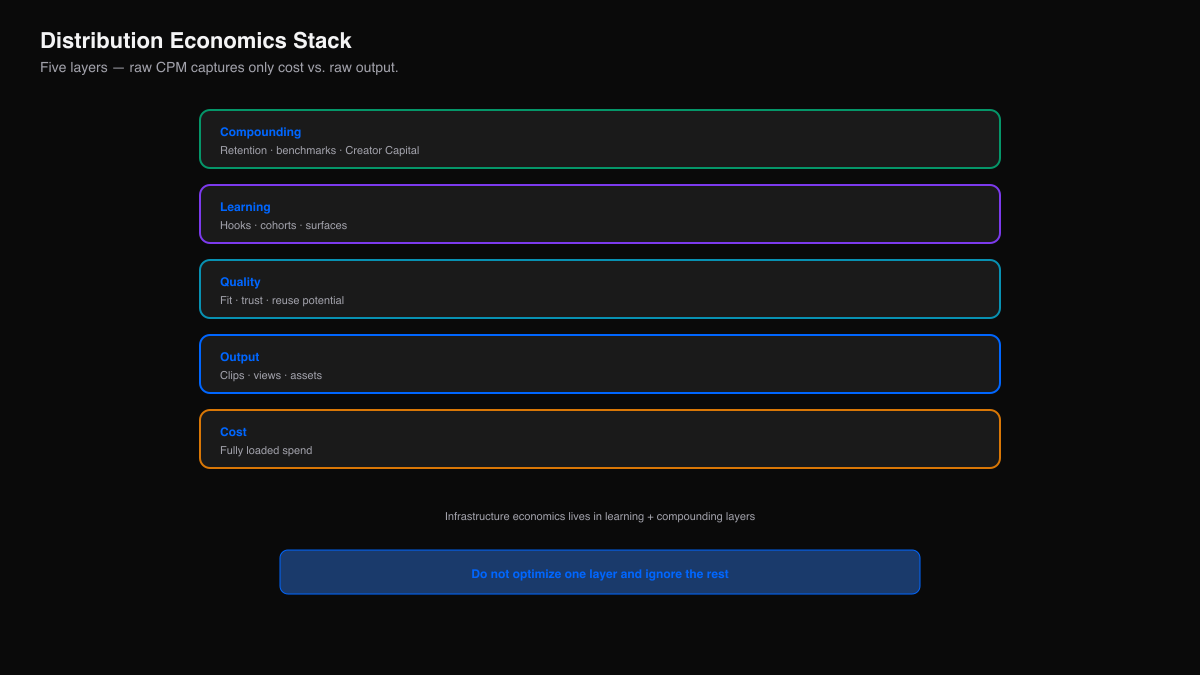
The Distribution Economics Stack
The Distribution Economics Stack is the layered model for measuring creator-powered distribution performance.
It has five layers.
| Layer | Question | Example Metrics |
|---|---|---|
| Cost Layer | What did the system consume? | Creator payouts, platform fees, tooling, labor, source-content cost, review time, risk cost |
| Output Layer | What did the system produce? | Clips, published posts, raw views, qualified views, reusable assets |
| Quality Layer | How valuable was the output? | Audience fit, watch time, engagement quality, claim safety, creator fit, asset reuse potential |
| Learning Layer | What did the system learn? | Winning hooks, creator cohorts, source themes, surface performance, objection patterns |
| Compounding Layer | What future advantage was created? | Creator retention, Creator Capital, benchmark improvement, lower future launch cost, faster reallocation |
The stack prevents the most common measurement error: judging a multi-output system through a single-output metric.
Paid media economics are usually cleaner because the purchase object is clearer. The buyer pays for impressions, clicks, conversions, or other platform-mediated outcomes. There is still measurement complexity, but the transaction is more standardized.
Creator-powered distribution is messier because the system creates multiple outputs at once.
A single campaign might produce:
- 180 submitted clips.
- 95 approved clips.
- 72 published clips.
- 3.2 million raw views.
- 900,000 qualified views.
- 14 reusable paid-media assets.
- 9 validated hook families.
- 4 high-performing creator cohorts.
- 26 creators worth retaining.
- 3 new audience pockets.
- 40 comments that reveal objections.
- 6 sales-enablement clips.
If the operator asks only for CPM, most of that value disappears.
The correct economic model itemizes the outputs before drawing conclusions.
Units Before Economics
Bad economics usually begin with bad units.
Before a team calculates cost per anything, it must define the unit being counted. This is especially important in Creator-Powered Distribution because the same campaign can produce different unit types.
Core Unit Types
| Unit | Definition | Economic Use |
|---|---|---|
| Source Asset | Original media object used as raw material | Measures source-content ROI and content liquidity |
| Clip Unit | Atomic short-form content unit derived from source material | Measures production and packaging output |
| Approved Asset | Clip or post approved for use or publication | Measures quality and review efficiency |
| Published Asset | Approved asset that goes live on a distribution surface | Measures creator activation and launch reliability |
| Raw View | Platform-reported view without qualification filter | Useful as a top-level volume measure only |
| Qualified View | View that meets predefined relevance, surface, duration, geography, audience, or engagement criteria | Used for Creator-Powered CPM and CPQV |
| Qualified Attention Event | Audience interaction that meets attention-quality criteria beyond basic view count | Used for deeper distribution efficiency analysis |
| Reusable Asset | Asset that can be reused in paid media, sales, email, landing pages, or future campaigns | Used for asset economics |
| Validated Learning | Finding strong enough to alter future creative, creator, surface, or budget decisions | Used for learning economics |
| Qualified Outcome | Campaign-defined business or strategic result that meets qualification criteria | Used for outcome economics |
| Creator Retention Event | Creator returns, submits again, or improves after feedback | Used for Creator Capital economics |
Each unit supports a different economic question.
If the question is production efficiency, cost per approved asset matters.
If the question is attention efficiency, Creator-Powered CPM matters.
If the question is business efficiency, cost per qualified outcome matters.
If the question is infrastructure maturity, creator retention, learning yield, reallocation speed, and operational reliability matter.
The first rule of Chapter 9 is:
Never calculate economics until the unit is defined.
Cost Basis: The Most Common Source of Bad Comparisons
Most channel comparisons are invalid because the cost basis is inconsistent.
A team may compare creator payouts against fully loaded paid media spend. Another team may compare platform ad spend against creator-powered campaign spend that includes management labor, review labor, platform fees, and bonus pools. A founder may compare the cost of a clipping campaign against an influencer sponsorship fee without counting the internal time required to source, negotiate, brief, approve, publish, whitelist, measure, and reuse the asset.
Those comparisons are not economic analysis. They are accounting mismatches.
Chapter 9 uses four cost bases.
1. Cash Payout Cost
Cash Payout Cost includes only direct creator, clipper, or publisher payouts.
This is useful for understanding incentive efficiency, but it is not sufficient for channel comparison.
Formula:
Cash Payout Cost = Fixed Creator Payouts + Performance Payouts + Bonuses
Use this when evaluating creator incentives.
Do not use it alone when comparing against paid media or agency execution.
2. Gross Campaign Cost
Gross Campaign Cost includes creator payouts plus platform or vendor fees directly tied to the campaign.
Formula:
Gross Campaign Cost = Creator Payouts + Platform Fees + Campaign Fees + Direct Production Fees
Use this when evaluating campaign-level cost.
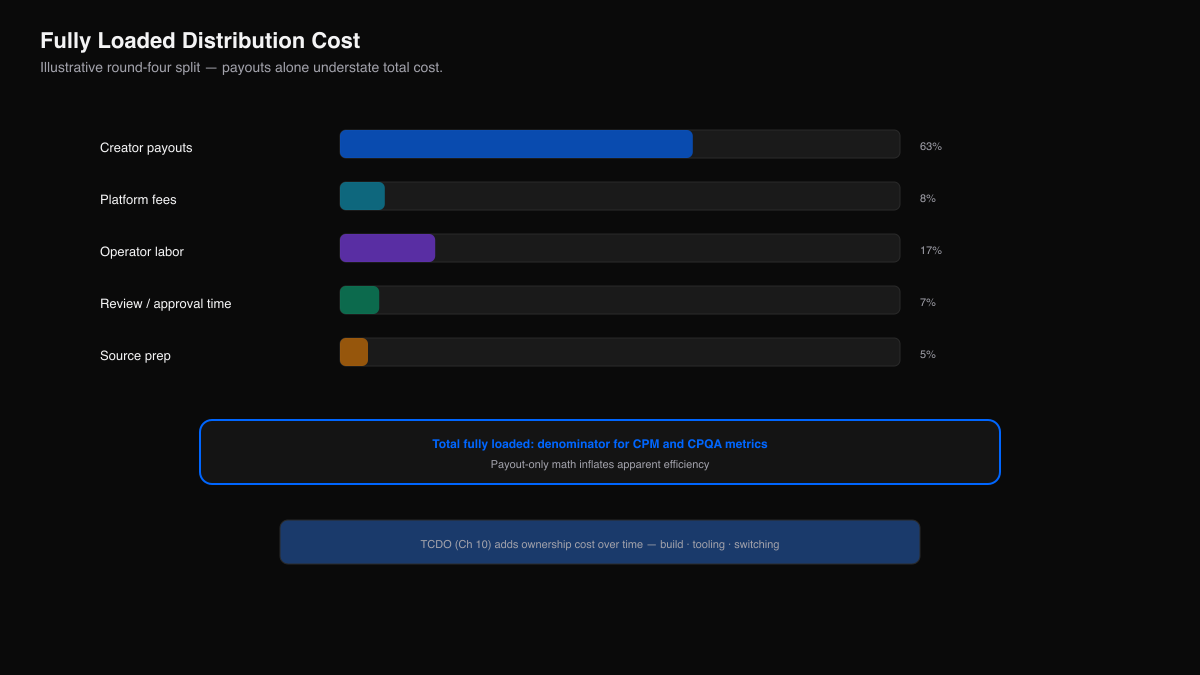
3. Fully Loaded Distribution Cost
Fully Loaded Distribution Cost includes all direct campaign costs plus internal labor, review time, source-content preparation, operations, tooling, rights, measurement, and governance cost.
Formula:
Fully Loaded Distribution Cost = Gross Campaign Cost + Internal Labor Cost + Review Cost + Tooling Cost + Rights Cost + Measurement Cost + Governance Cost + Risk Adjustment
Use this when comparing creator-powered distribution against paid ads, influencer sponsorships, agencies, in-house content, or hybrid operating models.
4. Total Cost of Distribution Ownership
Total Cost of Distribution Ownership measures the ongoing cost to build, operate, govern, measure, and improve a distribution infrastructure system over time.
Formula:
Total Cost of Distribution Ownership = People + Tools + Platform Fees + Creator Incentives + Source Content + Operations + Governance + Data Infrastructure + Opportunity Cost + Risk Cost
This belongs partly in Chapter 10, but Chapter 9 introduces it because unit economics can look attractive while ownership economics are weak.
A campaign can be efficient and still be a poor internal build candidate if the company lacks the operating capacity to run it repeatedly.
A platform can look expensive on a fee line and efficient on total ownership cost if it reduces workflow drag, shortens launch cycles, improves creator matching, lowers fraud risk, and captures better benchmarks.
The second rule of Chapter 9 is:
Compare channels only after normalizing cost basis.
Creator-Powered CPM
Creator-Powered CPM measures the cost per thousand qualified creator-powered views or impressions.
Formula:
Creator-Powered CPM = (Total Creator-Powered Distribution Cost / Qualified Creator-Powered Views) x 1,000
The important word is qualified.
Raw-view CPM is useful as a diagnostic, but it is not the canonical economic measure. Raw platform views can vary by platform definition, autoplay behavior, audience quality, geography, duplication, bot or invalid activity, watch duration, content context, and intent.
A qualified view should be defined before the campaign starts.
Possible qualification criteria include:
- Minimum watch duration.
- Platform-specific view threshold.
- Geography fit.
- Language fit.
- Audience category fit.
- Creator category fit.
- Engagement quality.
- Comment relevance.
- Brand-safety compliance.
- Claim-safety compliance.
- Duplicate-reach adjustment.
- Downstream click or visit proxy.
Different campaigns can use different qualification rules. The requirement is not universal sameness. The requirement is explicit definition.
Raw CPM vs. Qualified CPM
| Metric | Formula | Use | Risk |
|---|---|---|---|
| Raw Creator-Powered CPM | (Total Cost / Raw Views) x 1,000 | Top-level reach efficiency | Can reward low-quality attention |
| Qualified Creator-Powered CPM | (Total Cost / Qualified Views) x 1,000 | Attention efficiency | Requires disciplined qualification rules |
| Efficiency-Adjusted CPM | (Total Cost / Quality-Adjusted Views) x 1,000 | Cross-campaign comparison | Requires stable scoring model |
| Fully Loaded Creator-Powered CPM | (Fully Loaded Cost / Qualified Views) x 1,000 | Channel comparison | Requires labor and overhead estimates |
A campaign should report all relevant versions, not just the most flattering one.
The reporting convention should be:
- Raw CPM.
- Qualified CPM.
- Fully loaded qualified CPM.
- Efficiency-adjusted CPM if quality scoring is mature.
That sequence keeps the system honest.
Cost Per Qualified View
Cost Per Qualified View is the same logic as Creator-Powered CPM expressed per individual qualified view.
Formula:
CPQV = Total Creator-Powered Distribution Cost / Qualified Views
CPQV is often easier for operators to understand than CPM because it shows the exact marginal attention cost.
Example structure:
| Input | Value |
|---|---|
| Total creator-powered distribution cost | C |
| Raw views | V |
| Qualified view rate | q |
| Qualified views | V x q |
| CPQV | C / (V x q) |
| Creator-Powered CPM | (C / (V x q)) x 1,000 |
The useful question is not whether CPQV is universally low. The useful question is whether CPQV is attractive for the audience, objective, and business model.
A $0.03 qualified view may be expensive for broad entertainment awareness and cheap for a B2B software campaign reaching a narrow buyer segment.
A $0.50 qualified view may be unacceptable for low-margin ecommerce and attractive for enterprise sales if it produces high-quality proof assets and pipeline influence.
Qualified attention economics are contextual.
The third rule of Chapter 9 is:
A benchmark without a campaign objective is not a benchmark.
Cost Per Qualified Outcome
A Qualified Outcome is a predefined business or strategic result that meets campaign-specific qualification criteria.
Qualified outcomes can include:
- Qualified website visit.
- Email signup.
- Application start.
- Demo request.
- Trial signup.
- Purchase.
- Community join.
- Sales conversation influenced.
- Brand search lift proxy.
- Retargeting audience created.
- Qualified comment or objection captured.
- Reusable sales asset created.
- Creator retained for future campaign.
The formula is simple:
Cost Per Qualified Outcome = Fully Loaded Distribution Cost / Qualified Outcomes
The complexity is attribution.
Creator-powered distribution often affects behavior indirectly. A viewer may watch a clip, later search the brand, click a different channel, join a community, or mention the content to a peer. Not every valuable outcome will be directly attributable.
This does not mean outcome economics should be ignored. It means the attribution window and confidence level must be stated.
Outcome Confidence Levels
| Confidence Level | Description | Example |
|---|---|---|
| Direct | Outcome is directly tracked from a campaign link, code, landing page, or creator-specific path | Creator post drives tracked signup |
| Assisted | Outcome occurred after exposure or engagement but not through a direct click path | Prospect references creator clip on sales call |
| Proxy | Outcome indicates likely business effect but is not proof | Branded search increase, qualified comment volume, retargeting audience growth |
| Strategic | Outcome has value but is hard to tie to immediate conversion | Founder credibility, category education, investor attention, creator relationship |
For mature reporting, use all four levels separately.
Do not blend them into one inflated outcome count.
Worked outcome example: what referral tracking proves—and what it does not
An anonymized sports-related application used a launch-day creator sprint built around a global event. The campaign required an exact referral CTA and link on approved creator posts. It combined quote-post activation, video-link posts, approved visuals, original captions, and rejection rules for copied or misleading work.
The campaign reported:
- Thousands of creator posts and clips.
- Millions of views.
- More than 18,500 registered users in one week.
- Top-20 referral performance on the platform.
The referral structure is important because it created a direct measurement path from individual creator activity to registration. That is stronger than assuming that views caused signups.
It still does not answer every economic question.
The available report does not establish that every one of the 18,500 registrations came from clipping. It does not disclose the fully loaded campaign cost, revenue, deposits, trading activity, retention, or lifetime value. Without those fields, we cannot honestly calculate a complete cost per qualified outcome or claim profitability.
The correct conclusion is:
The campaign paired large-scale creator distribution with trackable referral paths and reported meaningful registration volume inside a one-week window.
The incorrect conclusion is:
Clipping caused 18,500 profitable customers.
High-authority reporting is not about weakening the result. It is about making the result strong enough to survive a skeptical reader.
Evidence note: Anonymized Clipur internal campaign and referral report, one-week launch window in 2026. Client identity withheld. Registration, view, clip-volume, and referral-rank figures were reported; fully loaded cost, revenue, and retention were not available in the published case materials.
Approval Economics
Creator-powered distribution has a production funnel. Not every source asset becomes a good clip. Not every clip is approved. Not every approved clip is published. Not every published clip gets attention. Not every attention event is qualified.
The economics of the system depend on those drop-offs.
Core Funnel Metrics
| Funnel Stage | Metric | Formula |
|---|---|---|
| Source Intake | Source acceptance rate | Approved source assets / Submitted source assets |
| Clip Submission | Submission rate | Submitted clips / Activated creators |
| Review | Approval rate | Approved clips / Submitted clips |
| Publishing | Published asset rate | Published clips / Approved clips |
| Attention | Raw view yield | Raw views / Published clips |
| Qualification | Qualified view rate | Qualified views / Raw views |
| Reuse | Reusable asset rate | Reusable assets / Approved clips |
| Learning | Validated learning rate | Validated learnings / Campaign |
| Retention | Creator retention rate | Returning creators / Activated creators |
Approval rate is especially important because it connects creator-network quality, brief quality, source-content quality, and governance clarity.
A low approval rate may mean creators are weak.
It may also mean the brief is unclear.
It may mean source content has low liquidity.
It may mean the brand is over-restrictive.
It may mean the claim zones are poorly defined.
It may mean the campaign is paying for the wrong behavior.
The metric is diagnostic, not just evaluative.
Approval Cost
Cost Per Approved Asset = Fully Loaded Distribution Cost / Approved Assets
Approval cost should be interpreted alongside reusable asset rate and performance. A campaign with a high cost per approved asset may still be efficient if the assets are unusually valuable, reusable, or conversion-relevant.
A campaign with a low cost per approved asset may be inefficient if the assets are low-quality, off-brand, or unusable outside the initial post.
Approval economics require quality adjustment.
Asset Economics
Creator-powered campaigns often produce media assets that outlive the initial distribution window.
This matters because reusable assets change the economic calculation.
A paid ad impression usually disappears after the impression is served. The creative asset may remain useful, but the purchased distribution does not persist unless the buyer pays again.
A creator-powered clip can produce immediate attention and then become:
- Paid ad creative.
- Retargeting creative.
- Landing-page proof.
- Sales-deck insert.
- Email asset.
- Founder social post.
- Customer-success training example.
- Community content.
- Course material.
- Recruiting or employer-brand asset.
- Future creator brief example.
That reuse creates asset value.
Cost Per Reusable Asset
Cost Per Reusable Asset = Fully Loaded Distribution Cost / Reusable Assets
This should be paired with asset quality and reuse count.
Asset Reuse Multiple
Asset Reuse Multiple = Total Reuses / Reusable Assets
Asset Yield
Asset Yield = Reusable Assets / Approved Assets
A campaign with moderate attention performance but high asset yield can still be economically valuable.
This is especially true for B2B, high-ticket consumer, education, creator-led businesses, events, expert brands, and categories where trust proof is scarce.
The fourth rule of Chapter 9 is:
Do not evaluate creator-powered distribution only at first publication.
Benchmark Architecture
Chapter 9 is the benchmark chapter, but the most important benchmark rule is restraint.
There is no honest universal Creator-Powered CPM.
There is no honest universal clipping approval rate.
There is no honest universal qualified-view rate.
There is no honest universal creator retention rate.
The economics of Creator-Powered Distribution vary by:
- Vertical.
- Audience.
- Platform.
- Geography.
- Source-content type.
- Creator tier.
- Creator node type.
- Incentive model.
- Claim risk.
- Asset rights.
- Content liquidity.
- Campaign objective.
- Review strictness.
- Measurement maturity.
- Brand familiarity.
- Distribution surface.
- Time period.
A benchmark becomes useful only when its cell is specific enough.
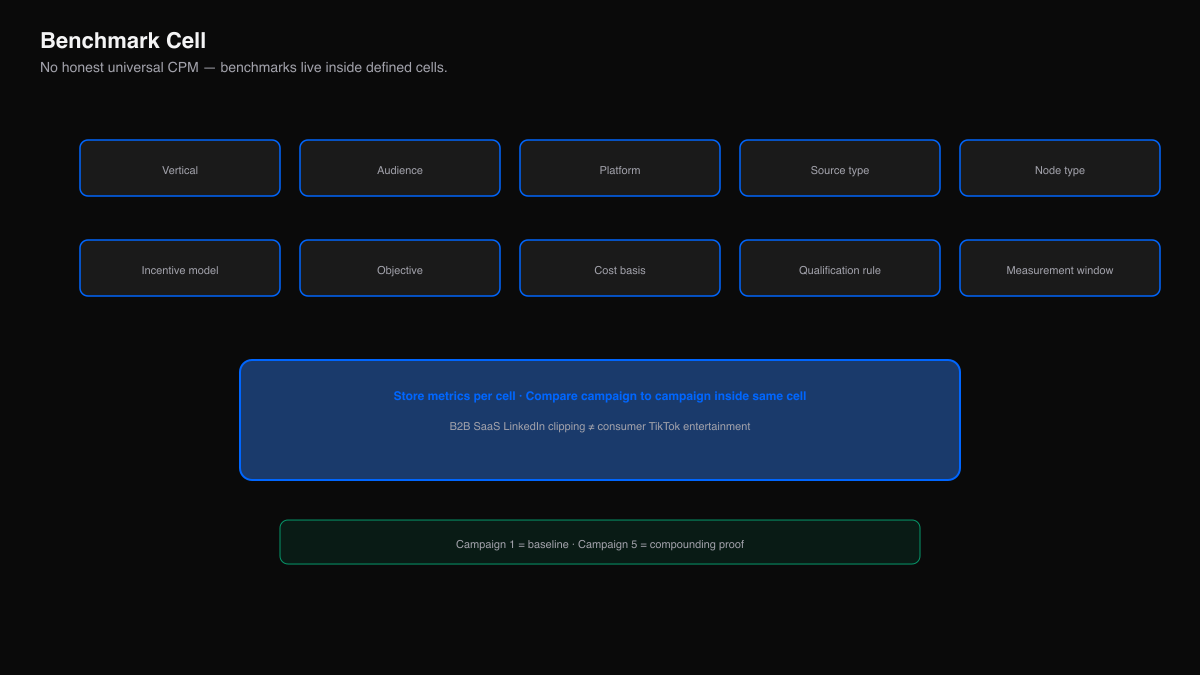
Benchmark Cell
A Benchmark Cell is a defined segment of performance data that shares enough context to support comparison.
Example benchmark cell:
- Vertical: B2B SaaS.
- Audience: U.S. founders and marketing operators.
- Platform: LinkedIn.
- Source type: founder interview.
- Mechanism: paid clipping campaign.
- Creator node type: operator-commentary creators.
- Incentive model: hybrid approved-clip plus performance bonus.
- Objective: qualified attention and demo-intent proxy.
- Measurement window: 14 days after publication.
- Cost basis: fully loaded campaign cost.
A CPM benchmark from that cell should not be applied to consumer entertainment TikTok clips or ecommerce creator whitelisting.
The benchmark table must be segmented.
Required Benchmark Dimensions
| Dimension | Examples |
|---|---|
| Vertical | SaaS, finance, health, education, consumer app, ecommerce, gaming, creator business, event, media |
| Audience | Founder, marketer, student, consumer buyer, investor, creator, developer, operator |
| Platform | TikTok, Instagram Reels, YouTube Shorts, LinkedIn, X, Facebook, newsletter, community |
| Surface | Feed, short-form video, story, carousel, repost, quote post, comment thread, livestream clip |
| Source Type | Podcast, founder talk, webinar, demo, customer story, event footage, livestream, product explainer |
| Creator Tier | Micro, mid-tier, macro, niche expert, clipper node, publisher node, employee creator |
| Mechanism | Clipping, sponsorship, ambassador, affiliate, syndication, UGC, community distribution |
| Incentive Model | Fixed, performance, bonus, hybrid, affiliate, retainer |
| Objective | Awareness, qualified attention, traffic, lead, sale, trust proof, sales assist, retargeting pool |
| Cost Basis | Cash payout, gross campaign, fully loaded, TCDO |
| Measurement Window | 24 hours, 7 days, 14 days, 30 days, 90 days |
| Qualification Rule | Watch time, geography, audience fit, engagement quality, conversion proxy, claim safety |
A benchmark without these dimensions is a talking point, not a decision tool.
Budget Reallocation Logic
The economics chapter should not end with reporting. It should end with reallocation.
A campaign report that does not change future allocation is administrative overhead.
Creator-powered distribution should use explicit reallocation rules.
Reallocation Inputs
| Input | Reallocation Question |
|---|---|
| Creator-Powered CPM | Should more budget move toward this creator, source, or platform? |
| CPQV | Is qualified attention cost improving or worsening? |
| Qualified Outcome Rate | Is attention turning into meaningful action? |
| Approval Rate | Is creator supply producing usable output? |
| Asset Yield | Is the campaign creating reusable media? |
| Learning Yield | Is the system getting smarter? |
| Creator Retention | Is the network becoming more valuable? |
| Review Cycle Time | Is operational drag suppressing creator output? |
| Failure Type | What bottleneck should be fixed before scaling? |
| Claim-Safe Asset Rate | Can the campaign scale without increasing risk? |
Reallocation Actions
The campaign can respond by:
- Increasing payout for high-quality creator cohorts.
- Removing creator nodes with repeated low-quality output.
- Rewriting the clip brief.
- Narrowing or expanding claim zones.
- Moving budget between platforms.
- Increasing investment in high-liquidity source content.
- Retiring low-liquidity source formats.
- Turning winning clips into paid ads.
- Using winning clips as examples in future briefs.
- Changing the incentive model.
- Adding review capacity.
- Extending a campaign with strong half-life.
- Pausing a campaign with cheap but unqualified attention.
The fifth rule of Chapter 9 is:
Economics without reallocation is reporting theater.
Economic Decision Tree
The following decision tree can be used after each campaign cycle.
Step 1: Is the data usable?
If no, do not evaluate campaign success. Fix measurement.
Minimum usable data includes:
- Cost basis.
- Creator count.
- Submitted clips.
- Approved clips.
- Published clips.
- Raw views.
- Qualified view definition.
- Qualified views.
- Rejection reasons.
- Payout data.
- Basic platform/source/creator segmentation.
Step 2: Did the campaign produce qualified attention?
If no, diagnose source, creator fit, platform fit, hook quality, and qualification rules.
If yes, calculate CPQV and Creator-Powered CPM.
Step 3: Did the campaign produce reusable assets?
If no, inspect clip quality, brand constraints, source content, and approval standards.
If yes, calculate cost per reusable asset and asset reuse potential.
Step 4: Did the campaign produce validated learnings?
If no, inspect reporting cadence and retrospective quality.
If yes, document learnings and assign reallocation actions.
Step 5: Did the campaign produce qualified outcomes?
If no, decide whether the campaign was intended for attention, learning, or outcomes. Not every campaign should be judged by conversion.
If yes, calculate CPQO by confidence level.
Step 6: Did the campaign improve future capacity?
If no, inspect creator retention, benchmark capture, and process reliability.
If yes, update the benchmark library and increase infrastructure confidence.
Step 7: What is the operating decision?
Choose one:
- Scale.
- Iterate.
- Narrow.
- Pause.
- Retire.
- Rebuild infrastructure before next launch.
Public Benchmarks vs. Proprietary Benchmarks
Public market data can support category framing. It cannot replace Clipur-specific economics.
Public reports can show that creator advertising, social video, and digital video are large and growing. That supports the strategic relevance of the category.
But public reports usually cannot tell a Clipur operator:
- Expected approved clip rate for a given source type.
- Qualified view rate by creator node type.
- Creator-powered CPM by vertical and platform.
- Reusable asset yield by clip brief type.
- Creator retention by payout model.
- Failure rate by source-content liquidity.
- Reallocation speed by campaign maturity.
- Creator Capital formation by campaign cadence.
Those are proprietary benchmarks.
The public data says the market is worth measuring.
The internal data must say how to operate.
This is the data moat.
A company that only has public benchmarks can participate in the category.
A company with clean campaign-level benchmarks can define the category.
Read the whole book
The New Attention Economy: The Distribution Manifesto, 11 chapters, free to read and share.
Related courses
Related Clipipedia terms
CPM (Cost Per Mille)
CPM is the cost of one thousand impressions, a standard way to compare distribution efficiency.
Qualified View
A qualified view is a view that meets campaign-defined standards for relevance, validity, and measurement eligibility.
Creator-Powered Distribution
Creator-powered distribution is a model where a network of independent creators publishes brand content across their own accounts, multiplying reach far beyond a brand's owned channels.
Distribution Infrastructure
Distribution infrastructure is the repeatable system, network, tooling, and operations, behind continuous reach.
Creator-Powered CPM
Creator-Powered CPM is fully loaded campaign cost divided by qualified views, times 1,000.
CPQV (Cost Per Qualified View)
CPQV is fully loaded campaign cost divided by one qualified view.
When you are ready to apply it
Ready to launch a campaign?
Use Clipur to turn existing content into distributed short-form reach.